
Abstract
Proper nutritional intake is crucial for maintaining health and metabolic balance in the human body. Each individual has different nutritional needs depending on factors such as age, gender, height, weight, and other variables. This paper proposes a fuzzy logic-based nutritional recommendation system utilizing Mamdani and Sugeno inference models to provide food intake recommendations based on users' Body Mass Index (BMI) status and daily caloric intake targets. The recommendations provided consist of macronutrient consumption portions per person per day. The dataset used is the "Nutrition Daily Meals in Diseases Cases," which contains human physiological information from various ages, genders, heights, weights, and required daily macronutrient intake. This system is designed to process BMI input data and daily caloric intake targets to provide nutritional intake portion recommendations consisting of protein, calories, fat, and carbohydrates. Evaluation was conducted by comparing the performance of both fuzzy models in generating portions that correspond to the original data from the dataset document used. The results show that fuzzy logic-based approaches can help personalize nutritional recommendations more adaptively to user characteristics by considering human physiological factors and nutritional preferences.
Keywords: fuzzy logic, Mamdani, Sugeno, food recommendation system, nutrition, BMI
1. Introduction
1.1 Background
Balanced nutritional intake is a crucial factor in maintaining body health and preventing various metabolic diseases. In daily life, many individuals struggle to determine appropriate nutritional intake portions, especially when considering various factors such as age, gender, height, and weight. Therefore, a system that can help recommend food based on individual body conditions is needed.
Artificial intelligence-based nutritional recommendation systems have been extensively developed, but limitations still exist in terms of flexibility and adaptability to user data uncertainty. Fuzzy logic, as a soft computation method, offers an effective approach to handling uncertain or ambiguous information, such as in determining nutritional status based on Body Mass Index (BMI) and daily caloric consumption targets as user nutritional preferences.
In this paper, we design and implement a nutritional recommendation system using Mamdani and Sugeno fuzzy inference models. This system utilizes two main data sources: (1) "Nutrition Daily Meals in Diseases Cases" containing physiological information of several individuals with required nutritional portions, and (2) user BMI data calculated from age, height, and weight. This paper aims to document the evaluation results of the effectiveness of two fuzzy models in generating food recommendations suitable for individual nutritional needs.
1.2 Problem Statement
Based on the background outlined above, the main problem statements in this project are as follows:
-
How to design and implement a fuzzy logic system using Mamdani and Sugeno methods to predict daily nutritional requirement recommendations (calories, protein, fat, carbohydrates) based on input data consisting of BMI and daily caloric targets?
-
How to evaluate the performance of Mamdani and Sugeno fuzzy systems in predicting nutritional requirement recommendations using quantitative evaluation metrics (F1 Score) based on the dataset used?
-
How do the performance comparison results between Mamdani and Sugeno methods in the context of this nutrition recommendation case study compare, and which method shows better performance?
1.3 Scope and Limitations
This project work is limited by the following aspects:
-
Nutritional Focus: The recommendation system only focuses on predicting the needs of main macronutrients: calories (kcal), protein (grams), fat (grams), and carbohydrates (grams).
-
Main Input Variables: The main input variables used in the fuzzy system are Body Mass Index (BMI) derived from height, weight, and user age.
-
Dataset: The dataset used as the basis for analysis and evaluation is
detailed_meals_macros_CLEANED.csvwhich has undergone pre-processing as documented in the ipynb notebook. -
Fuzzy Methods: Implementation focuses on Mamdani and Sugeno inference methods.
-
Implementation Environment: Implementation is carried out using Python programming language with standard libraries such as numpy, pandas, matplotlib, and seaborn. Core fuzzy logic implementation refers to functions created manually in the notebook.
2. Implementation Method
2.1 Dataset
This system implementation uses the "Nutrition Daily Meals in Diseases Cases" dataset by utilizing processed data, namely detailed_meals_macros_CLEANED.csv. Based on the implementation design in the pre-processing stage, this dataset contains information about individuals, including age, gender, height, weight, physical activity level, dietary preferences, and daily nutritional targets such as target calories, protein, sugar, sodium, fat, carbohydrates, and fiber. This dataset becomes the foundation for building nutritional requirement models.
Before modeling, descriptive statistical analysis was performed on the main relevant numerical features (such as age, height, weight, target calories, protein, fat, carbohydrates).
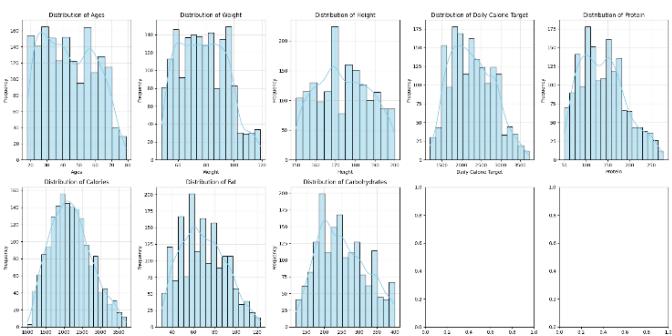
Figure 1: Data Distribution
2.2 Data Preprocessing
This stage is crucial for ensuring the quality of data to be used in fuzzy modeling. Although the author previously mentioned that the data used is labeled as cleaned, this process still needs to be performed to ensure the data used is suitable. Based on the implementation in the notebook attached to this report, the following steps were performed:
- Feature Selection: Features selected as main inputs for the fuzzy system are age, height, weight, and daily caloric targets. Target features (output) to be predicted are daily calories, protein, fat, and carbohydrates. Other features such as gender, activity level, and dietary preference are not explicitly used as inputs. This feature selection considers correlations between values in the dataset, as shown in the following correlation matrix:
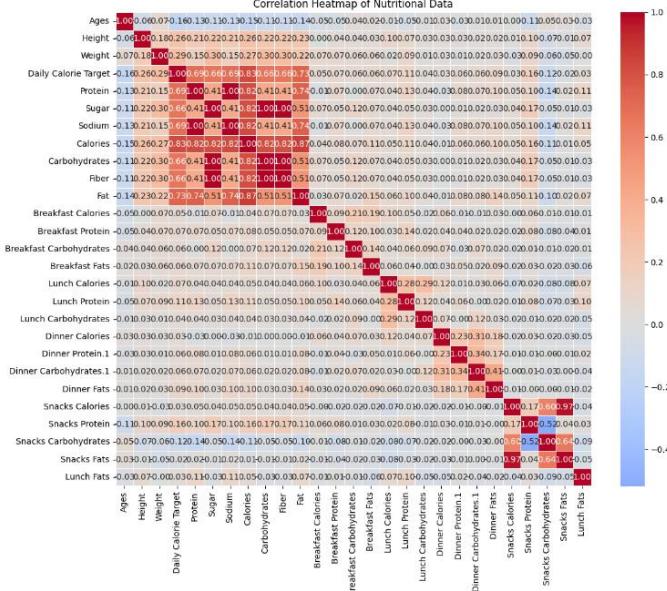
Figure 2: Correlation Matrix on Dataset
- Outlier Handling: Outliers in selected numerical features were handled using the interquartile range (IQR) method. Data outside the lower bound (Q1 - 1.5 * IQR) and upper bound (Q3 + 1.5 * IQR) were identified and removed from the dataset.
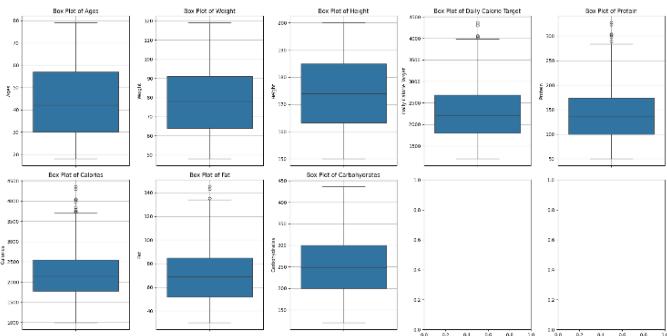
Figure 3: Boxplot of data before cleaning
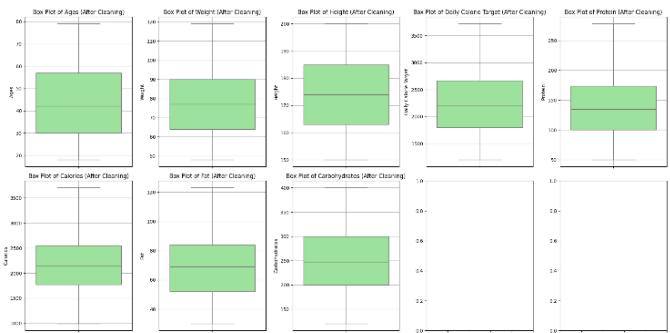
Figure 4: Boxplot of dataset after cleaning
- BMI Calculation: The Body Mass Index (BMI) feature was calculated based on weight (kg) and height (m) features. The formula used is:
This BMI feature then becomes one of the main inputs in the fuzzy system, replacing the direct use of height and weight.
2.3 Fuzzy System Design
Fuzzy system design involves defining input and output variables, fuzzy sets (membership functions), rule base, inference mechanisms, and defuzzification methods.

Figure 5: Fuzzy Model Architecture
Overall, there are three main parts in this fuzzy system implementation:
2.3.1 Input Variables
BMI: Represented by four linguistic values: Underweight, Normal, Overweight, and Obese. The membership function used is a combination of linear functions (triangular/trapezoidal) with specific value boundaries defined in the following functions:
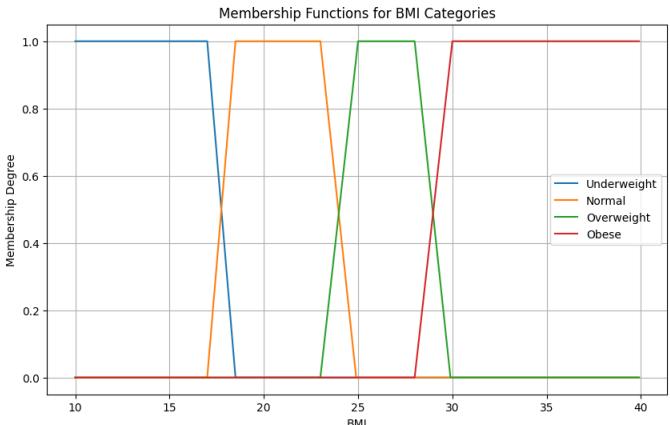
Figure 6: BMI Membership Function
Age: Represented by three linguistic values: Young, Middle, and Elderly. The membership function used is also triangular/trapezoidal with age boundaries defined in the main functions young, middle, and elderly.
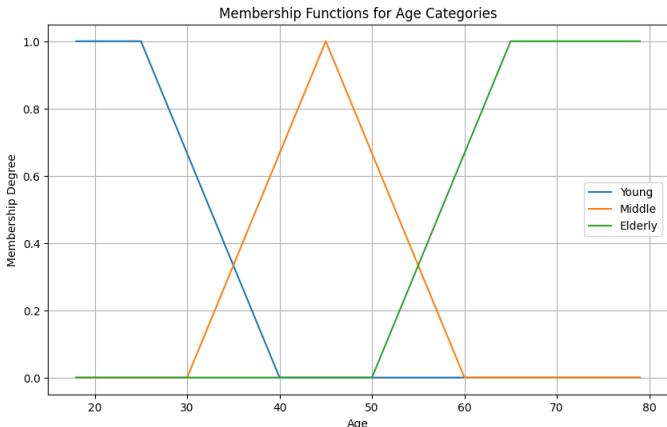
Figure 7: Age Membership Function
Daily Calories Intake: Represented by three linguistic values: Low, Moderate, and High. The membership function is triangular/trapezoidal.
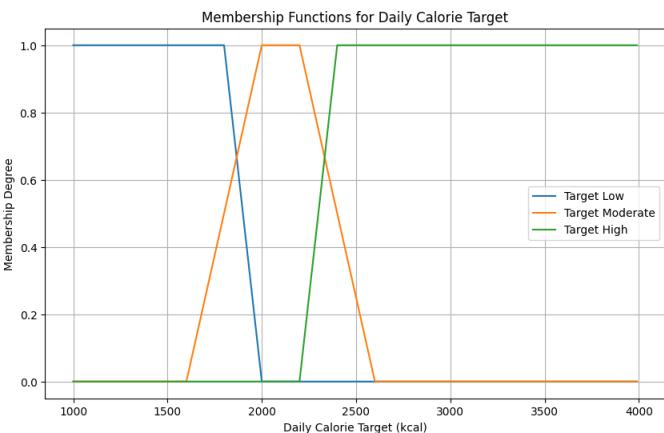
Figure 8: Daily Calories Target Membership Function
2.3.2 Output Variables
Calories: Represented by three linguistic values: Low, Moderate, and High. The membership function is triangular/trapezoidal defined in functions low_calories, moderate_calories, and high_calories.
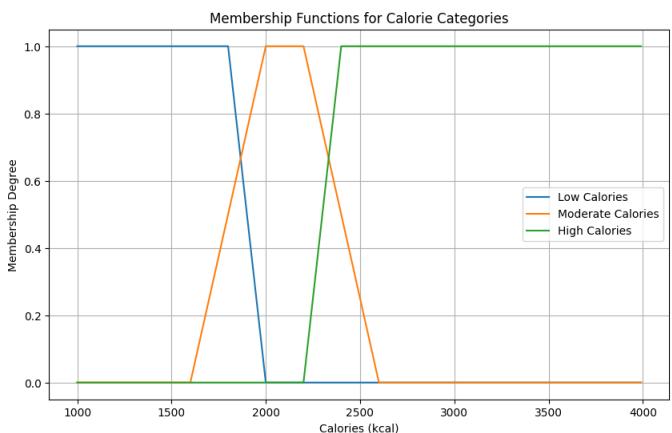
Figure 9: Calories Membership Function
Protein: Represented by three linguistic values: Low, Moderate, High. The membership function is defined in functions protein_low, protein_moderate, and protein_high.
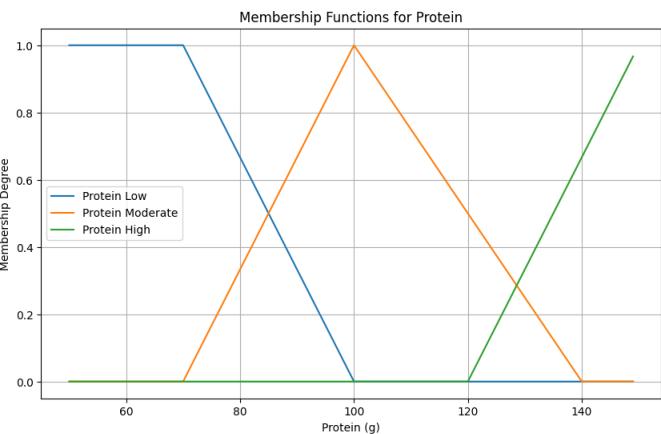
Figure 10: Protein Membership Function
Carbohydrates: Represented by three linguistic values: Low, Moderate, and High. The membership function is defined in functions carbs_low, carbs_moderate, and carbs_high.
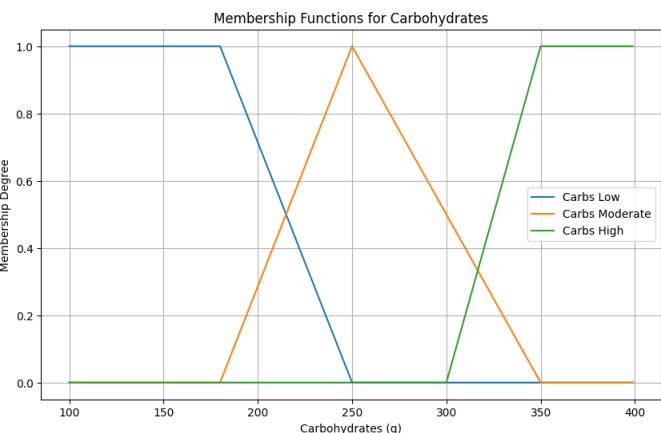
Figure 11: Carbohydrates Membership Function
Fat: Represented by three linguistic values: Low, Moderate, High. The membership function is defined in functions fat_low, fat_moderate, and fat_high.
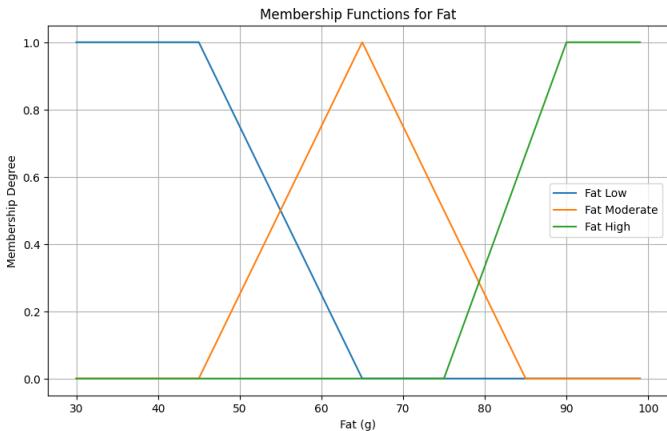
Figure 12: Fat Membership Function
2.3.3 Fuzzification Process
Numerical input values (BMI, age, and caloric targets) are converted into membership degrees for each relevant fuzzy set using predefined membership functions.
In addition to membership functions in the fuzzification stage, there is also a fuzzy rule base containing a series of IF-THEN rules that connect combinations of input conditions (BMI, age, and caloric target linguistic values) with output consequences (calories, protein, fat, carbohydrate linguistic values). In implementation, these rules are created comprehensively covering all input combinations. Each rule evaluates antecedent conditions (IF part) using the fuzzy AND operator (represented by the min function in code), which takes the minimum membership value from all involved input conditions. The strength resulting from antecedent evaluation is then used to determine the activation level of each consequent (THEN part) on corresponding output variables.
For example, a rule might state: IF BMI is underweight AND age is young AND daily caloric target is target_low, THEN Calories is cal_moderate, Protein is prot_high, Carbohydrates is carb_high, and Fat is fat_moderate. The strength of this rule will be applied to each of these output terms.
This system has a main rule structure organized by BMI category (underweight, normal, overweight, and obese), which is then further divided by age (young, middle, senior), and finally by caloric targets (target_low, target_moderate, target_high). With 4 BMI categories, 3 age categories, and 3 caloric target categories, there are a total of 4 × 3 × 3 = 36 basic rule combinations, each generating recommendations for all four output variables (Calories, Protein, Carbohydrates, Fat).
When multiple rules lead to the same conclusion for a specific output linguistic term (for example, several different rules suggest cal_moderate for Calories), the maximum strength from those rules is taken as the aggregation value for that output term (represented by the max function in code, such as output_agg['Calories']['cal_moderate'] = max(output_agg['Calories']['cal_moderate'], strength)). This process ensures that the strongest contribution from any relevant rule will dominate the aggregation for each output term.
Additionally, there are also special nutritional optimization rules. These rules are designed to handle specific scenarios or input contributions considered important and requiring more precise output adjustments or certain priorities. For example, special rules might emphasize high protein intake for young obese individuals targeting caloric deficit, or ensure maximum nutrition for normal young individuals with high caloric targets. These special rules are also evaluated using the min operator for antecedents and max for consequent aggregation, potentially interacting with and updating aggregation values already set by main rules.
Furthermore, to apply rules in the rule base to fuzzified inputs to generate fuzzy outputs, we use two methods: Mamdani and Sugeno. Both methods have their own characteristics in processing given fuzzy information.
Mamdani Method:
- Implication Operator (AND): Uses MIN operator to combine membership degrees from conditions in rule antecedents
- Aggregation Method: Uses MAX operator to combine fuzzy outputs from all active rules
Sugeno Method:
- Implication Operator (AND): Uses MIN operator
- Rule Output: Generates crisp output in the form of constant values for each rule. These constant values are determined based on data analysis or expert knowledge
The final step needed to obtain crisp values from fuzzy inference results is defuzzification. We also use Mamdani and Sugeno methods in processing crisp values with the following specifications:
Mamdani Method:
Uses the Center of Area (CoA) method, which calculates the center of mass point of the area under the aggregate output membership function curve.
Sugeno Method:
Uses the Weighted Average method, where crisp output is calculated as the average of each rule's constant output, weighted by the firing strength (activation degree) of each rule.
2.4 Evaluation Metrics
To evaluate and compare the performance of Mamdani and Sugeno fuzzy systems in recommending nutrition, evaluation was conducted by comparing model prediction results against actual data. Considering the nature of fuzzy system outputs that ultimately aim to provide recommendations in certain categories, the evaluation metric used is Weighted F1-Score. This metric is commonly used for classification tasks and provides a balanced performance measure.
2.5 Implementation Results
Fuzzy system implementation, both Mamdani and Sugeno, was performed to predict four main nutritional targets: Calories, Protein, Fat, and Carbohydrates. The process involves input fuzzification (BMI and Age), inference rule application, and defuzzification to generate numerical prediction values.
PREDICTION RESULTS IMPLEMENTATION | |||||||||
|---|---|---|---|---|---|---|---|---|---|
| No | BMI | Age | Target | Actual_Cal | Mamdani_Cal | Sugeno_Cal | Actual_Prot | Mamdani_Prot | Sugeno_Prot |
| 1 | 24.7 | 25 | 2000 | 2020.0 | 2100.0 | 2100.0 | 120.0 | 103.4 | 100.0 |
| 2 | 23.9 | 32 | 1800 | 1498.0 | 1471.3 | 1400.0 | 80.0 | 103.8 | 100.0 |
| 3 | 31.0 | 48 | 2200 | 2185.0 | 2458.6 | 1400.0 | 100.0 | 103.4 | 100.0 |
| 4 | 27.3 | 55 | 2500 | 2680.0 | 1764.6 | 1750.0 | 140.0 | 112.1 | 115.0 |
| 5 | 29.4 | 62 | 2800 | 1815.0 | 1463.1 | 1400.0 | 80.0 | 81.8 | 78.0 |
| 6 | 25.0 | 68 | 1400 | 1555.0 | 1449.7 | 1400.0 | 78.0 | 83.3 | 80.1 |
| 7 | 27.7 | 28 | 3000 | 2840.0 | 2100.0 | 2100.0 | 100.0 | 119.4 | 130.0 |
| 8 | 26.0 | 35 | 2400 | 2220.0 | 2100.0 | 2100.0 | 120.0 | 112.1 | 115.0 |
| 9 | 32.1 | 42 | 3200 | 3005.0 | 2100.0 | 2100.0 | 160.0 | 103.4 | 100.0 |
| 10 | 27.6 | 58 | 1900 | 1670.0 | 1579.3 | 1540.0 | 75.0 | 90.3 | 85.5 |
Figure 13. Implementation of Prediction Results
From the table above, several important observations can be made regarding the predictions from both models:
1. Prediction Variation
Both the Mamdani and Sugeno models produce varied prediction values across different input combinations. This indicates that the fuzzy inference system is responsive to changes in BMI, age, and calorie targets.
2. Calorie Predictions
In several cases (e.g., entries 1, 7, 8, and 9), both Mamdani and Sugeno models produced identical calorie predictions of 2100 kcal. However, discrepancies arise in other cases. For instance, in entry 2, the actual calorie value is 1480 kcal. The Mamdani model predicted 1471.3 kcal—very close to the actual—while the Sugeno model predicted 1400 kcal. Generally, the Sugeno model tends to output rounded values, while Mamdani may produce decimal-based results.
3. Protein Predictions
Protein predictions also show noticeable variation. For example, in entry 4, the actual protein value is 140g. The Mamdani model predicted 112g, and Sugeno predicted 115g—both underestimating, with Sugeno being slightly closer.
Conversely, in entry 2, the actual protein is 80g, while Mamdani predicted 103.8g and Sugeno predicted 100g, both overestimating the need. In some cases (entries 1, 2, 3, and 9), Sugeno consistently predicted 100g, while Mamdani varied.
This implementation output provides an initial look at how the Mamdani and Sugeno fuzzy systems operate in generating nutritional recommendations. It is evident that neither model consistently outperforms the other in every test case. A deeper and more objective performance evaluation using quantitative metrics is necessary, which is addressed in the next section.
F. Evaluation of Model Performance
The evaluation focuses on how well each model classifies nutritional outputs (Calories, Protein, Carbohydrates, and Fat) into appropriate linguistic categories (Low, Medium, High) after defuzzification. The primary metric used is the Weighted F1 Score, which balances precision and recall across output classes.
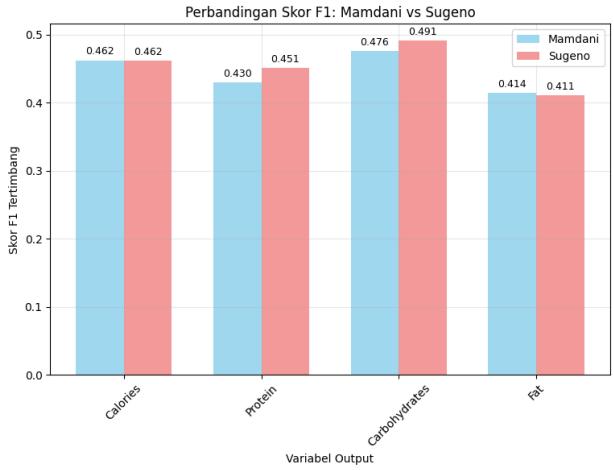
To provide detailed insights, the Weighted F1 Score is calculated individually for each nutritional variable. The performance comparison between the Mamdani and Sugeno models is shown in Figure 14:
Analysis by Output:
-
Calories: Both models achieved identical Weighted F1 Scores of 0.462, indicating comparable performance in classifying calorie needs.
-
Protein: Sugeno slightly outperformed Mamdani, with scores of 0.451 vs 0.430 respectively. This suggests that Sugeno achieved better balance between precision and recall for protein classification.
-
Carbohydrates: This variable yielded the highest F1 scores. Sugeno scored 0.491, slightly better than Mamdani's 0.476, suggesting carbohydrate classification is the strongest among all outputs.
-
Fat: Both models showed the weakest performance here. Mamdani scored 0.414, marginally ahead of Sugeno’s 0.411. The lower scores indicate that both models struggle more with fat classification.
G. Overall Model Comparison
To evaluate overall performance, the average of the four Weighted F1 Scores was calculated for each model. The comparison is visualized in Figure 15:
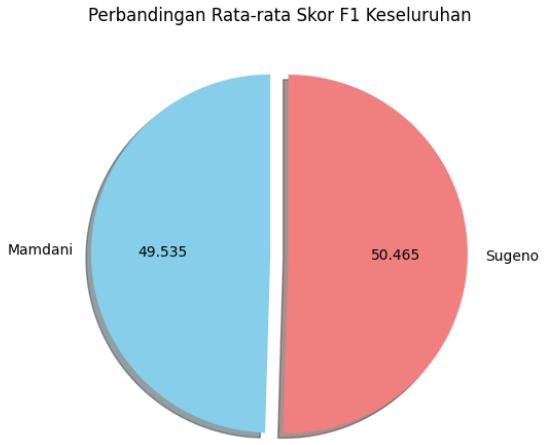
The results show that the Sugeno model has a slight overall edge, with an average Weighted F1 Score of 50.465%, compared to Mamdani’s 49.535%—a difference of less than 1%.
III. Conclusion
The comparison between the Mamdani and Sugeno fuzzy inference systems reveals that:
- Both models demonstrate moderate classification performance in recommending nutritional categories (Calories, Protein, Carbohydrates, Fat).
- The Sugeno model slightly outperforms Mamdani in overall performance, especially in predicting Protein and Carbohydrates.
- Carbohydrate predictions yielded the highest F1 Scores, while Fat predictions were the lowest for both models.
- Although promising, these fuzzy systems still show room for significant improvement to enhance reliability and accuracy for practical applications.
It is also important to note that the F1 Score provides a classification-based perspective, in contrast to regression metrics like R-squared, which focus on how close numeric predictions are to actual values. A model may perform poorly in numeric precision yet still categorize well into linguistic groups. In this study, the models performed moderately well in that regard.
References
[1] N. Britania, Nutrition Daily Meals in Diseases' Cases [Online]. Available at: https://www.kaggle.com/datasets/bitaniarielsen/nutrition-daily-meals-in-diseases-cases [2] Department of Health & Human Services USA, Make Every Bite Count with Dietary Guidelines. Washington: USDA, 2020 [3] L. Gilbert, What is a Good Body Fat Percentage? [Online]. Available at: https://www.healpline.com/health/exercise-fitness/ideal-body-fat-percentage
GitHub
https://github.com/devdezzies/fuzzy-nutrition